Wat we gebouwd hebben
Voor het Noord-Nederlandse Netwerk “Medicijnresten uit Water” van het Healthy Aging Network (HANNN) hebben we een visualisatiedashboard gebouwd. In dit dashboard visualiseerden we het voorschrijfgedrag van huisartsen en de medicijnresten in het rioolwater in twee wijken in Drachten.
De uitdaging
Elk jaar belandt er meer dan 190 ton medicijnresten in ons water. Dat heeft negatieve gevolgen voor het milieu, de flora en fauna en het drinkwater. Door klimaatverandering en toenemende vergrijzing zal dit probleem de komende jaren alleen maar verergeren. Om deze uitdaging vanuit diverse invalshoeken te benaderen is het Netwerk Medicijnresten uit Water Noord-Nederland opgericht. In dit netwerk zitten 46 partijen uit de zorg, watersector, overheid, kennisinstellingen en technologiesector. Sinds 2022 is ook Researchable bij dit netwerk aangesloten. Onze rol in het netwerk was om te onderzoeken hoe data inzicht kan geven in de aard van de problematiek. Hiertoe focusten we ons op twee wijken in Drachten: een zogeheten ‘bloeizone’, waar veel aandacht is voor een gezonde leefstijl, en een wijk waar dat nog niet het geval is. Door deze twee wijken te vergelijken op voorschrijfgedrag en medicijnresten in water kunnen we hopelijk meer inzicht geven in hoe we het probleem van medicijnresten kunnen aanpakken.
Doelen van het project
- •Visualiseren van voorschrijfdata van huisartsen.
- •Visualiseren van medicijnresten in rioolwater vanuit monsternames.
De oplossing
Researchable heeft een interactief dashboard ontwikkeld om de voorschrijfdata van de huisartsen in de twee wijken te visualiseren, evenals de aangetroffen medicijnresten in het rioolwater binnen deze wijken. De concentratie van zo'n dertig medicijnresten waren gemeten in het rioolwater. Op de lijst stonden geneesmiddelen met een grotere impact op het milieu en ook degenen die gebruikt zijn tegen leefstijl-gerelateerde ziekten.
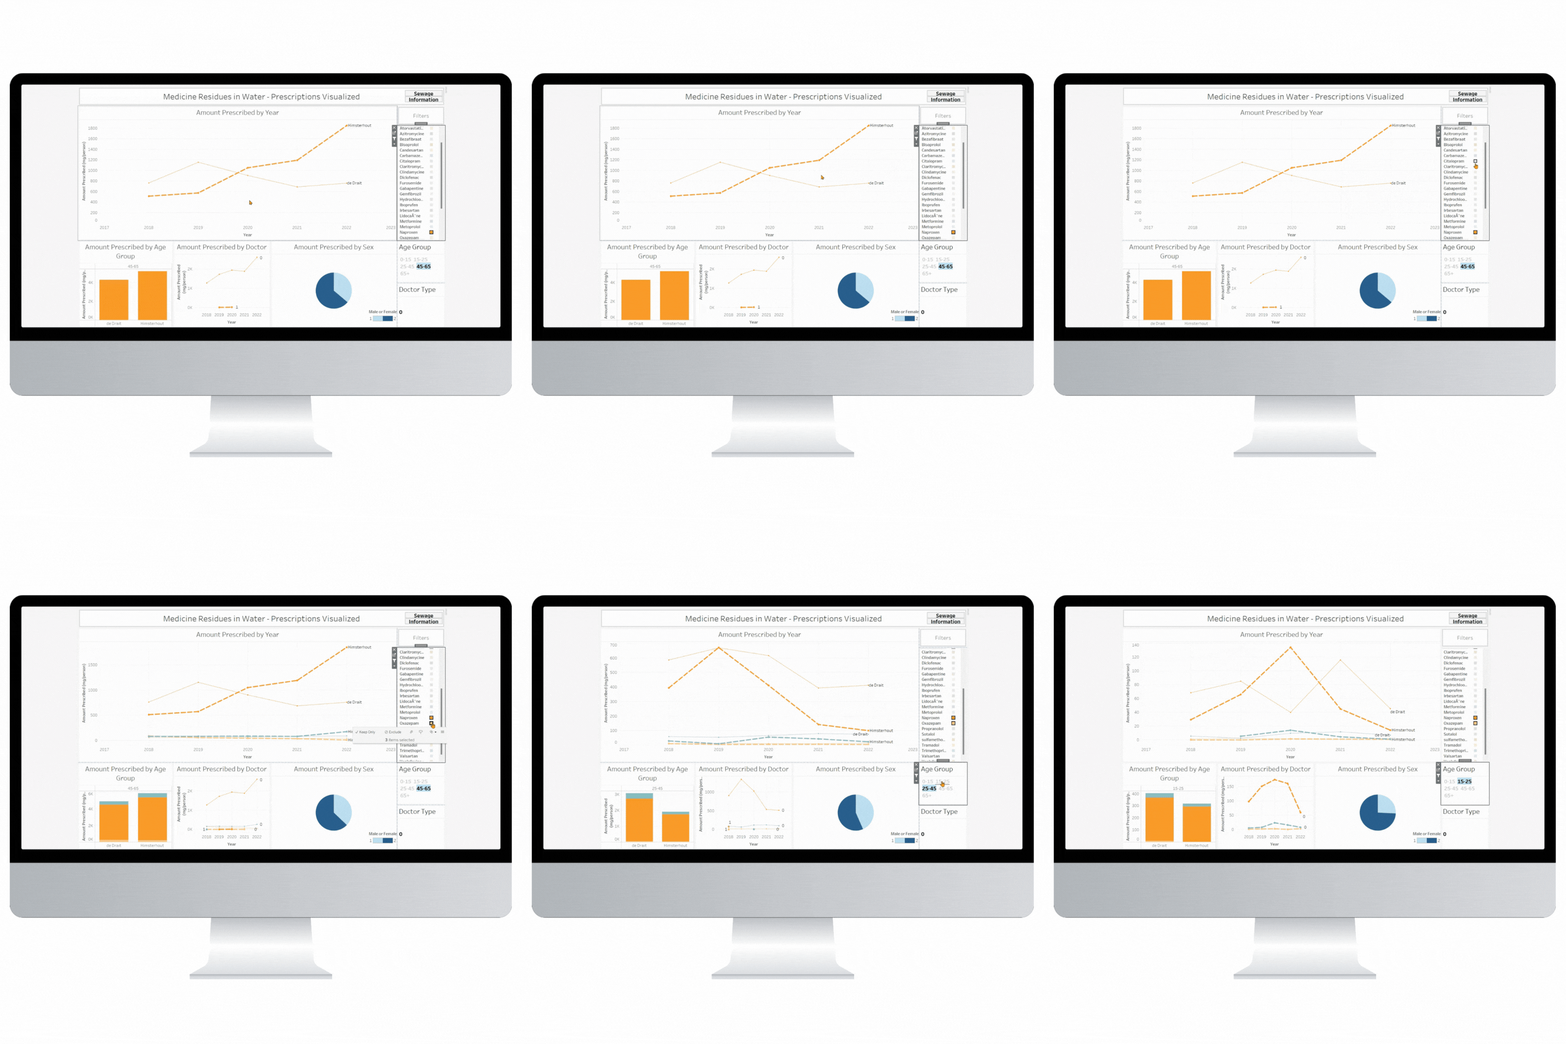
Hieronder is het dashboard afgebeeld. Per medicatietype is inzichtelijk gemaakt hoe vaak het wordt voorgeschreven. Ook is zichtbaar hoe dit verschilt per jaar, leeftijdsgroep en geslacht.
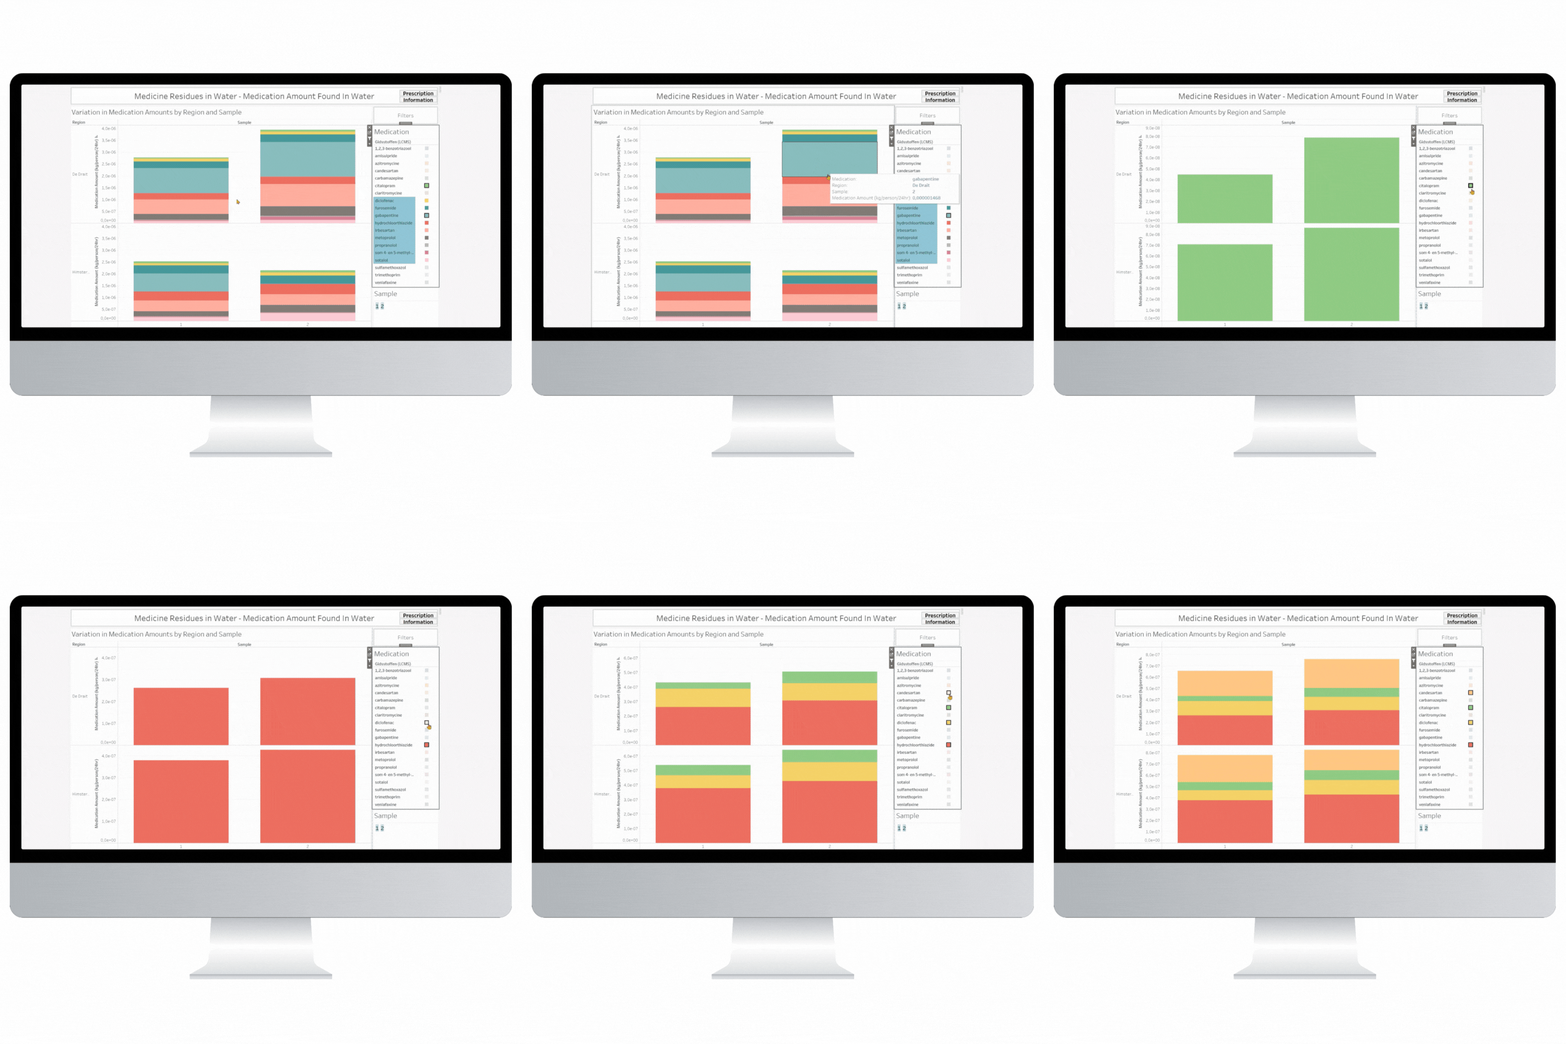
Ook hebben we zichtbaar gemaakt in welke mate de voorgeschreven medicijnen terug te zien waren in het riool.
Het vervolg
Het is duidelijk dat het visualiseren van voorschrijfgedrag en medicijnresten in het water interessante inzichten kan bieden in de potentiele milieu-impact van ons medicijngebruik. Ons dashboard kan worden toegepast op nieuwe datasets om van meer huisartsen en zorginstellingen het voorschrijfgedrag inzichtelijk te maken.
